
The failure is easy to miss: your service process is running, the port is open, and the health check is green. Then the work stops.
A green health check can miss the payment, queue, and execution boundaries because “alive” describes only one part of a paid service. The machine may be reachable while its operator identity is stale on-chain, its price endpoint is returning old offers, or its runner is accepting requests that never reach a job handler.
Tangle is a protocol for registering and coordinating services run by independent operators. Blueprint operator monitoring is the practice of watching those boundaries separately. A Blueprint is a packaged service definition with typed jobs that declare their inputs and outputs. An operator is the person or service that runs an instance of that Blueprint and commits infrastructure to it. A runtime is the process and execution environment that receives a job and performs the work. A Blueprint Runner is the runtime component that receives and dispatches typed job calls. A service instance is one registered deployment of a Blueprint, identified by a service ID. A Blueprint ID identifies the service definition, and a job index identifies one callable operation inside it. A quote is a time-limited price offer for a job.
Tangle’s public Quality of Service (QoS) documentation describes heartbeats, Prometheus-compatible metrics, optional logs, and custom on-chain metrics as parts of the same operating surface. Prometheus is the metrics format and scrape endpoint; Grafana is the dashboard layer that can display those metrics. The QoS integration guide is the current reference for wiring those pieces.
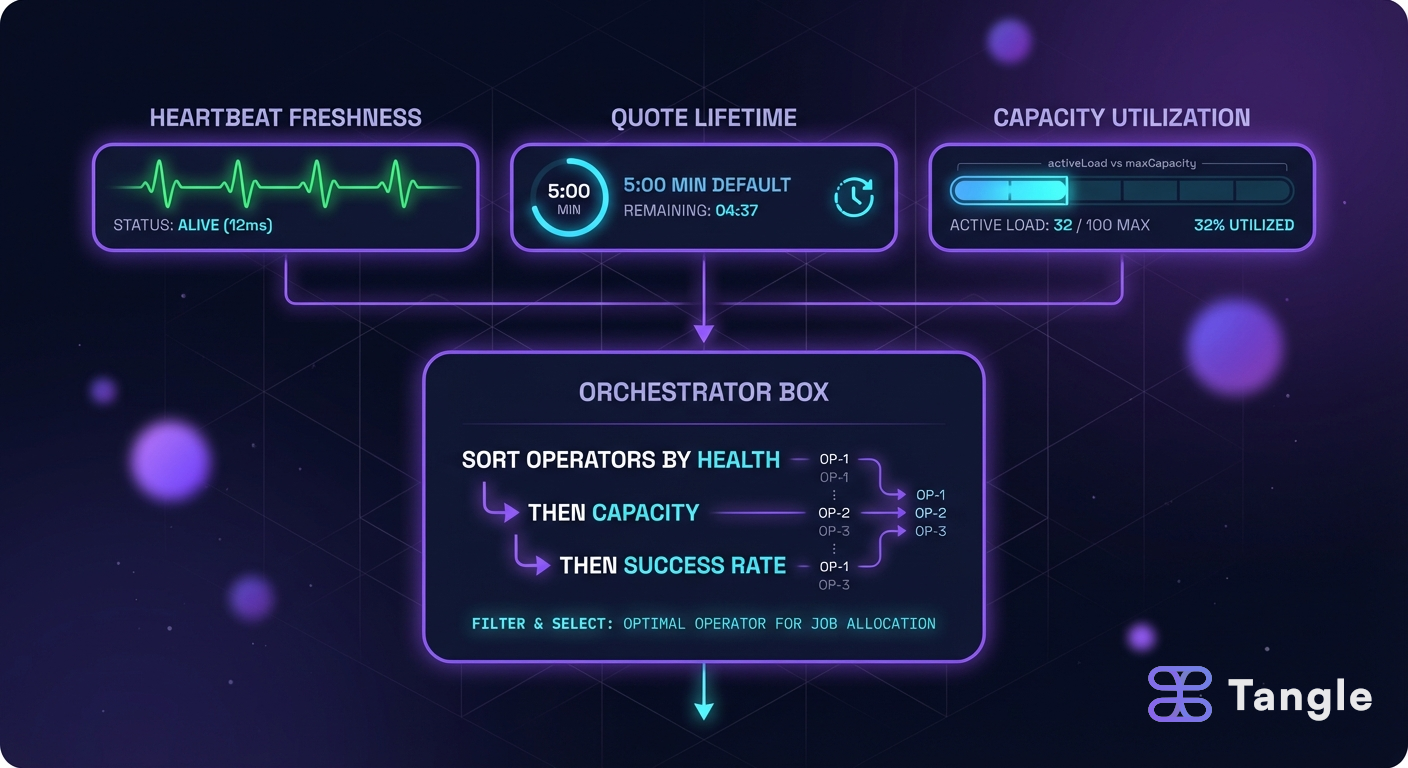
A green process is not a selectable operator
Start with the path a paid request takes.
client
  -> price or payment challenge
  -> payment verification
  -> job enqueue
  -> Blueprint runner
  -> job handler
  -> result and receipt
The chain heartbeat observes one part of this path. The local metrics endpoint observes another. The quote and payment records add a commercial clock.
| Signal | What it answers | What it cannot answer |
|---|---|---|
| Runtime health | Is the process responding? | Can the protocol see a live operator? |
| Heartbeat | Has this operator recently reported liveness for this service? | Did the last job produce a correct result? |
| Price endpoint | Can a caller discover a current price? | Has the caller paid or received work? |
| Queue depth | Is work waiting inside the runner? | Did the operator’s transaction settle? |
| Job result | Did this execution finish? | Was the price fresh when the request began? |
| Payment record | Was the commercial condition satisfied? | Is the returned output useful or correct? |
One process check cannot see payment settlement, queue depth, or completed job results. An alert without service_id, job_index, operator, and payment-to-call identifiers cannot identify the failing path.
Heartbeats are a protocol signal, not a process probe
The Blueprint QoS service submits periodic liveness signals to Tangle’s OperatorStatusRegistry. The registry is the on-chain record used to track whether an operator is responding for a service. The heartbeat is signed with an operator key and associated with a service and Blueprint.
The cadence is configuration, not a universal promise. The public SDK exposes fields such as interval_secs and max_missed_heartbeats, so the service owner and operator can reason about the actual tolerance instead of borrowing a number from another deployment.
The current documentation shows the shape of an explicit configuration:
let qos = QoSServiceBuilder::new()
    .with_heartbeat_config(HeartbeatConfig {
        service_id,
        blueprint_id,
        interval_secs: 60,
        jitter_percent: 10,
        max_missed_heartbeats: 3,
        status_registry_address,
    })
    .with_heartbeat_consumer(Arc::new(consumer))
    .with_http_rpc_endpoint(rpc_url)
    .with_keystore_uri(keystore_uri)
    .with_status_registry_address(status_registry_address)
    .build()
    .await?;
The values above are an illustrative configuration from the public guide, not a network-wide default. The important operational facts are that the heartbeat needs a signing key, an RPC path, a registry address, and a retry policy that fits the service’s tolerance for absence.
A heartbeat can fail even when the job handler is healthy. Common causes include an unavailable RPC endpoint, an unreadable keystore, a wrong registry address, a rejected transaction, and a clock or nonce problem. An RPC (remote procedure call) endpoint is the network node interface used to submit or read chain requests. That is why the monitor should track heartbeat submission attempts and confirmed on-chain state separately.
For an operator, the first useful query is the current state for the specific service and address. The registry reference includes isHeartbeatCurrent, getOperatorState, getMetricValue, and getSlashableOperators. Use the operator status and metrics documentation to match the call names to the version of the contracts you are operating.
Keep local metrics and on-chain metrics in different buckets
Tangle exposes two metric paths with different consequences.
Local metrics are for Prometheus, dashboards, and incident response. On-chain metrics are numeric values included in heartbeats and stored in the status registry so a service owner or monitor can inspect them later.
Local metrics support triage; on-chain metrics support policy checks. A local job_duration_seconds series can use high-cardinality labels, meaning labels with many distinct values, because it is designed for operations. An on-chain response_time_ms value should be small, stable, and defined by a service owner because every submitted value becomes part of a public protocol record.
The public QoS guide distinguishes add_custom_metric() for Prometheus and Grafana from add_on_chain_metric() for values used in service-level policy. Do not send every debug counter on-chain. Choose metrics that a caller can interpret without access to your private dashboard.
When a service owner defines a MetricDefinition, it can specify a name, inclusive minimum and maximum values, and whether the metric is required.
An out-of-range value or a missing required value emits a MetricViolation event.
The current documentation is explicit that a violation does not auto-slash an operator.
An off-chain keeper can monitor the event and call reportForSlashing when policy warrants a slashing proposal.
Local metrics stay operational, while bounded on-chain metrics remain public policy inputs. Operators are not punished for a single transient spike by a blind threshold. Service owners still receive a durable signal they can combine with job failures, customer reports, and heartbeat history.
Monitor the paid HTTP path as a separate service
The current Blueprint x402 gateway provides health, stats, price, payment/auth responses, and synthetic call identifiers for monitoring. x402 is an HTTP payment protocol in which a server returns 402 Payment Required and a client signs a payment payload. In Tangle’s gateway, the payment is verified and settled through the configured facilitator before the gateway enqueues work. A JobCall is the runner’s typed record that carries an accepted job from the gateway or producer to the Blueprint handler.
The Blueprint integration exposes:
GET /x402/health
200 OK

ok

GET /x402/jobs/42/0/price
200 OK

{
  "price_wei": "1000000000000000"
}

POST /x402/jobs/42/0
202 Accepted

{
  "service_id": 42,
  "call_id": 17,
  "status": "queued"
}
The response body above is a simplified shape for the monitoring conversation. Use the current Blueprint x402 gateway documentation for the exact fields exposed by the version you run.
The most important line is 202 Accepted. In this integration, it means the payment was accepted and the job was enqueued. It does not mean the job has completed.
A monitor that counts every 202 as a successful job will report excellent reliability while work is stuck behind a full queue. Carry the synthetic service and call identifiers into the result path so you can measure accepted, started, completed, failed, and abandoned jobs as distinct states.
The price endpoint deserves its own alert. It can answer whether a job is priced and enabled for x402, but it does not prove that the runner is ready. The gateway’s default invocation mode is disabled, and jobs are enabled one by one with job_policies. The current docs say an unpriced job is not callable through the gateway.
With that fail-closed default, unpriced or unapproved jobs cannot accept paid requests through the gateway. It also means a new job can be perfectly implemented and still return an error until its price and invocation policy are intentionally added.
Alerts separate stale liveness, queue saturation, and quote expiry
Metric names differ across deployments, so define them around states rather than copying a vendor dashboard. The following names are illustrative:
blueprint_heartbeat_submission_failures_total
blueprint_heartbeat_current{service_id,operator}
blueprint_job_queue_depth{service_id,job_index}
blueprint_job_execution_seconds
blueprint_job_failures_total{reason}
blueprint_quote_generation_failures_total
blueprint_quote_age_seconds
blueprint_paid_requests_total{state}| Alert | First question | Safe first action |
|---|---|---|
| Heartbeat submission failures | Is the key, RPC, nonce, or registry address wrong? | Preserve the last good state and repair submission before changing job code. |
| isHeartbeatCurrent becomes false | Did the chain miss the configured tolerance or did the reader use the wrong service? | Compare local submission logs with the on-chain service and operator identifiers. |
| Quote generation failures | Is the pricing input unavailable or invalid? | Stop advertising new paid work until a fresh, inspectable price is available. |
| Quote age rises while demand continues | Are callers waiting longer than the configured quote lifetime? | Reduce downstream latency or return a fresh quote before retrying. |
| Queue depth rises after 202 responses | Is the runner saturated or is a consumer disconnected? | Cap admission and preserve the payment-to-call correlation. |
| Metric violations appear | Is the bound too tight, the metric missing, or the workload degraded? | Investigate the evidence; do not treat the event as automatic slashing. |
| Payment accepted but completion rate falls | Is the failure in execution, result delivery, or reconciliation? | Separate refunds, retries, and operator recovery instead of retrying blindly. |
The alert should include service_id, blueprint_id, job_index, operator address, and the last observed call identifier. Those fields turn “the service is unhealthy” into a query another person can run.
Failure paths from health check to job result
The process is healthy but the heartbeat is stale. The runtime can answer /x402/health while the RPC provider rejects transactions. The fix belongs in the signing and chain path, not in the job handler.
The heartbeat is current but jobs fail. Liveness proves that an operator is reporting, not that the Blueprint returns valid outputs. Inspect runner logs, input validation, dependency errors, and result callbacks.
The price is current but payment succeeds and work never appears. The gateway may have accepted the payment and queued a JobCall while the producer or runner is disconnected. Treat the payment as a reconciliation record and the job as a separate state machine.
The metric violates its bounds while customers remain satisfied. The metric definition may be measuring the wrong thing or using a threshold that does not match the job’s normal distribution. Change the service policy only after reviewing the actual values and the false-positive cost.
A second process probe cannot distinguish stale heartbeats, queued calls, or failed results. The monitor needs to preserve the transition from request to payment to queued call to result.
Check gateway, price, heartbeat, queue, and result state
When a paid Blueprint appears offline, check in this order:
- Read the gateway health and stats endpoints without sending a paid request.
- Read the price endpoint for the exact service and job pair that is failing.
- Compare the latest local heartbeat attempt with the on-chain liveness result.
- Check queue depth and the age of the oldest queued call.
- Trace one paid request from its quote or payment reference to its synthetic Tangle call identifier.
- Decide whether to disable admission, repair the runtime, or wait for an in-flight result.
- Reconcile any payment that succeeded before the job failed or the response was lost.
The word “trace” here means a record that connects related events across those stages. A trace is useful only when it includes stable identifiers and timestamps, not when it is a decorative request ID printed in one log line.
Publish an operator contract that another person can inspect
Monitoring becomes useful when the operator can explain what each signal means to a caller. Write down the heartbeat interval and missed-heartbeat tolerance, the quote lifetime, the queue admission limit, the expected completion state, and the response to a stale or missing result. These are operating promises a caller can inspect.
Give every signal a stable identity. At minimum, include the service ID, Blueprint ID, job index, operator address, and environment. Avoid putting an unbounded request ID or customer identifier into every metric label, because high-cardinality labels can make the monitoring system itself expensive and slow. Keep those per-call identifiers in traces and structured logs instead.
The thresholds should come from the service’s observed behavior. For example, an alert at two missed heartbeats may be reasonable for a five-minute interval and dangerously slow for a job that expires in thirty seconds. A sample alert at 80 percent queue utilization may be useful for a short batch job and too late for a latency-sensitive call. Record the chosen threshold beside the reason and review it after a real incident.
Treat missing data as a state. Zero quote failures means no quote failure was recorded. No quote metric at all may mean the pricing worker stopped exporting, the label changed, or the scrape path broke. The alerting policy should distinguish those cases so that a silent exporter cannot look healthier than a busy but functioning service.
The Tangle operator services guide explains the service and operator relationship, while the operator health guide gives a neighboring view of heartbeat and quote-lifetime decisions. Use those concepts to write the contract for the actual Blueprint rather than copying a generic uptime target.
Turn the signals into a customer-facing view
An operator dashboard is not the same thing as a customer promise. Customers care whether a paid request was accepted, whether it started, whether it finished within the stated time, and what remedy exists when it did not. Expose those states in a small status view that uses the same identifiers as the internal trace.
For a simple service, a weekly reliability statement could look like this: P50 is the median value, and p95 is the value that 95 percent of completed jobs do not exceed.
| Measure | Count or distribution | Denominator |
|---|---|---|
| Paid requests accepted | 1,000 | Requests with valid payment |
| Jobs started | 992 | Accepted jobs |
| Jobs completed | 978 | Accepted jobs |
| Completion time | p50 18s, p95 74s | Completed jobs |
| Results requiring retry | 21 | Completed jobs |
| Payments needing reconciliation | 4 | Settled payments |
Those numbers are a reporting shape, not a claim about any Tangle service. The denominator prevents “978 completed” from sounding like 97.8 percent reliability when the service never counted accepted jobs. It also exposes where the loss occurs: before the worker starts, during execution, or after payment when the result is delivered.
Keep the heartbeat visible for operators and the job outcome visible for callers. A current heartbeat can support an admission decision, but it should not be presented as evidence that a particular paid job will complete. The customer-facing status should link to the job, payment, and result records without exposing private inputs or operator secrets.
How often should a Blueprint operator send a heartbeat?
Use the interval and missed-heartbeat tolerance configured for the service. The public QoS API exposes both values, and different services can make different availability tradeoffs.
Do on-chain metric violations slash operators automatically?
No.
The current QoS documentation says violations emit an event; an off-chain keeper can decide whether to call reportForSlashing.
Does a healthy x402 endpoint prove that a job is working?
No. The health endpoint checks the gateway surface. Use queue, execution, result, and payment-to-call metrics to verify the complete path.
What does 202 Accepted mean in the Blueprint x402 gateway?
It means the paid request was accepted and enqueued. It is not a completion receipt, so the caller needs a result contract or a way to observe the job later.
What should an operator monitor first?
Start with heartbeat submission and current on-chain state, quote generation and age, queue depth, job completion, and payment reconciliation. Those signals cover the main boundaries in a “the service is up but no work arrives” incident without pretending one number represents the whole system.
When those signals are visible, an operator can decide whether to keep serving, stop accepting new paid work, or repair the chain and runtime path. That decision is the purpose of monitoring.
Read the Tangle QoS guide for the current configuration surface and the Blueprint x402 gateway guide for the payment-to-job boundary. For the economics that follow those operational signals, see Blueprint x402 operator economics.