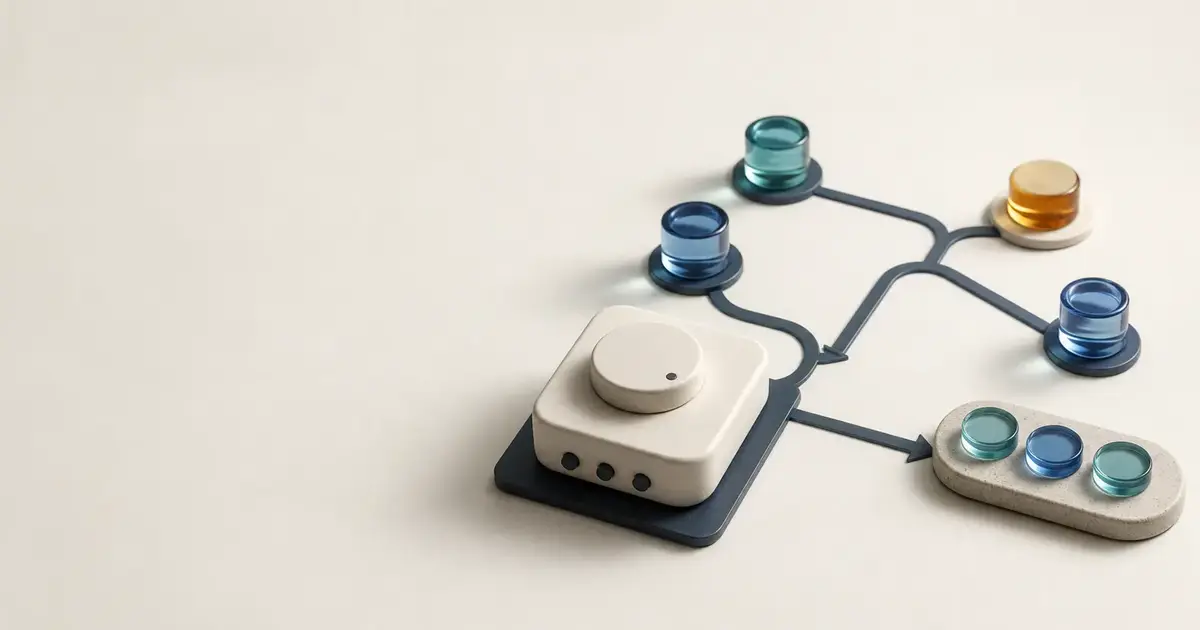
An automated coding worker is one running process of the agent, and it can run for several minutes while its screen shows nothing. The person waiting for it now has to guess whether the model is thinking, a command is running, the provider is disconnected, or the job already ended.
That guess changes product behavior. A parent program may restart useful work, leave a dead worker running, or tell a reviewer that a tool succeeded when it never ran.
AI agent observability starts with the decisions the surrounding system needs to make. For a worker, those decisions are usually whether to wait, steer, stop, restart, or accept the record. The shared bridge, an adapter between the runtime and a remote service, in Tangle’s public agent-runtime source now exposes enough live activity and requested-tool evidence to make those decisions narrower. It still leaves tool completion and duration unknown when the remote stream never reports them.
Good observability records what the system knows, what it does not know, and which decision each fact supports.
Define the run before adding a dashboard
An agent is a program that uses a language model and tools to complete a task. A worker is one running copy of that program. An agent runtime is the software that starts, controls, and records the worker.
A parent is the program that starts the worker and decides whether to wait, steer, stop, or restart it. A bridge is the adapter that sends the worker’s requests to a remote model service and translates its events back. A trace is the record of the run, including inputs, model events, tool requests, outputs, errors, and artifacts.
The word observability is useful only when it names an observation. “The agent is observable” is too broad. “The parent can read the current turn from a local event mirror” is testable. “The trace contains a tool request but no completion status” is also testable.
The OpenAI function-calling guide uses the term tool call for a model response that asks an application to invoke a function. In this article, a tool call means that request. It does not mean that the application invoked the function successfully.
Silence used to mean too many things
Before the bridge change, the parent had no live progress source and no trace source for the tool requests already arriving over the stream. It had to make decisions from the absence of a response.
| What might be happening | What the parent could see | Risk |
|---|---|---|
| The model is producing another turn | Silence | A useful worker is restarted |
| The worker is waiting on a remote service | Silence | The system waits forever |
| A tool request arrived | No settled tool record | A reviewer cannot inspect the requested action |
| The remote run was cancelled | Silence | The system reports a false timeout |
| The worker failed at the provider | Empty or incomplete result | The caller treats a failed run as a valid answer |
The bridge cannot solve all of these cases with one boolean called running. It needs separate facts with separate owners.
Three sources of truth
The public bridge implementation separates local activity, remote terminal state, and tool outcomes.
| Fact | Where it comes from | How quickly it is available | What it supports |
|---|---|---|---|
| Current turn and activity | Local mirror written while the stream is consumed | Immediately | Whether the worker is active |
| Remote run state | A separate status refresh | At most one refresh per second | Whether the remote run is terminal |
| Tool request | The model event in the incoming stream | As soon as the event arrives | What the worker asked to call |
| Tool completion | A tool-result event from the execution boundary | Not available on this bridge stream | No success or latency claim |
The local mirror contains the turn count, the current tool, turn or steering activity, queued steering messages, and the model information the executor derived from the worker declaration. A progress read uses those facts immediately. It does not wait for a new network request.
The remote service owns one fact the local worker cannot derive on its own.
Has the remote run become terminal?
The bridge schedules a status request to the source-specific endpoint GET /v1/runs/:id, limits that refresh to once per second, and removes the stale running note when the remote run ends.
That endpoint shape belongs to the bridge implementation described by the public change. It is not a universal Tangle endpoint that every agent application can call. The design lesson is the separation between a local read and a remote refresh.
Give every observation a freshness rule
A fact is not useful merely because it has a field name. The parent also needs to know where the fact came from and how old it may be. The local mirror can be read immediately, but it may be stale if the stream has stopped. The remote status can be authoritative for terminal state, but it is refreshed at a bounded interval. The tool request is tied to the moment the bridge decoded the model event.
An application can make that difference explicit:
type FreshObservation<T> = {
  value?: T
  source: 'local-mirror' | 'remote-status' | 'stream-event'
  observedAt: string
  staleAfterMs?: number
}
This is an illustrative type, not an exported package API.
The source field prevents a local activity read from being mistaken for a remote terminal answer.
The timestamp lets a caller decide whether an old observation is still safe to display.
The optional freshness limit makes “current” a policy rather than a permanent property of the record.
Consider a run with these events:
| Time | Observation | Safe interpretation |
|---|---|---|
| 12:00:00 | Local mirror reports a model turn | The worker was active when the mirror was updated |
| 12:00:01 | Tool request arrives | The model asked for the named tool |
| 12:00:02 | Client reads local state | The request is visible; its outcome is still unknown |
| 12:00:03 | Remote refresh reports running | The remote service has not reported terminal state |
| 12:00:04 | Stream disconnects | New activity is no longer observed; prior facts remain prior facts |
| 12:00:05 | Remote refresh reports cancelled | The remote run is terminal and recovery can begin |
This sample timeline shows why the client should not turn the 12:00:02 request into success because activity alone is not completion evidence. It should not call the worker dead merely because the local mirror has not advanced after a sample interval of 1 second. Freshness tells the parent when to wait, when to refresh, and when to degrade to unknown.
Polling more often does not create stronger evidence. It can increase load while returning the same remote state. The public bridge’s one-refresh-per-second limit is therefore part of the implementation boundary, not a promise that a remote run changes state every second.
An illustrative status record can make the boundary clear:
type WorkerObservation = {
  turn: number
  active?: {
    kind: 'model-turn' | 'tool-request' | 'steer'
    name?: string
  }
  queuedSteers: number
  remoteTerminal?: boolean
  requestedTools: string[]
  toolOutcome: 'unknown'
}
This is a teaching shape, not an exported package type. The value of the record is that it does not turn an absent field into a positive claim.
Record the request without inventing the result
The bridge now sends each incoming partial tool-call event through the same decoder used by the other stream sources. If one delta contains multiple calls, the trace records each call. It does not keep only the first.
The record can safely include:
| Field | What the bridge knows |
|---|---|
| Tool name | The function name supplied in the model event |
| Arguments | The arguments supplied in the model event |
| Request time | When the bridge observed the event |
| Request identity | The call identifier, when the provider supplied one |
The record must leave these fields unknown when no later event supplies them:
| Field | Why it stays unknown |
|---|---|
| Completion time | The bridge stream carries the model request, not the tool’s end event |
| Result status | A requested function can fail, be cancelled, or never start |
| Duration | A start timestamp plus no end timestamp is not a latency measurement |
Marking every request as successful would make a failed tool look healthy. Assigning an end time equal to the request time would create a false zero-millisecond duration. Both errors would leak into later success-rate and latency reports.
This is a small data-model decision with a large consequence. Unknown is a real state. It tells the next layer to collect evidence at the tool boundary if it needs a result.
A trace is not the same as a progress view
A progress view answers “what appears to be happening now?” A trace answers “what events did the runtime record?”
The local progress mirror can say that a tool request is active. The settled trace can preserve the request and its arguments. Neither one can say the tool succeeded unless the execution layer sends a result that the bridge captures.
The distinction matters when a run becomes an evaluation input. An evaluation is a structured check of a run or result against a stated criterion. For example, an evaluator can check that a requested file was changed, that tests passed, or that a response cites the right source. It must not treat a request-only tool span as a successful tool execution.
The CodeTraceBench benchmark article follows the same boundary at the analyst layer. A score can count whether an analyst named a labeled step. It does not automatically prove that the analyst’s evidence or repair was useful.
What the parent can decide now
Once the bridge exposes separate observations, the parent can use rules that match the evidence.
| Observation | Reasonable parent action |
|---|---|
| Local mirror shows an active model turn | Wait within the product’s time budget |
| Local mirror shows a requested tool | Keep the worker alive and record the request |
| Remote status is terminal | Stop waiting and settle or recover the run |
| Stream ends without a tool result | Preserve the request and leave its outcome unknown |
| Progress cannot be answered | Degrade to an unknown observation rather than failing the worker |
| Provider error is explicit | Mark the run failed and retain the error |
These are policy decisions, not automatic truths. The runtime supplies facts. The product decides how long to wait, whether to retry, whether a partial trace is acceptable, and whether a human must review it.
A common mistake is to make the telemetry path a new failure path. If a progress read waits on a remote status request, a slow status service can block the parent from stopping a worker. The public change avoids that coupling by reading local state immediately and refreshing remote state separately.
Another mistake is to make an unknown field look like an ordinary zero value. The code that calculates latency or success rate must preserve the distinction:
type ToolObservation = {
  requestedAt: string
  completedAt?: string
  status?: 'ok' | 'error' | 'cancelled'
}

function durationMs(observation: ToolObservation) {
  if (!observation.completedAt) return undefined
  return Date.parse(observation.completedAt) - Date.parse(observation.requestedAt)
}
This is illustrative code. The important behavior is that missing completion evidence returns no duration instead of zero.
Separate worker health from work progress
A worker can be alive while its progress is unknown.
A stream can be connected while the remote service has already cancelled the run.
A remote run can be terminal while the last tool request has no captured result.
These combinations are why one running flag is too small for the parent’s decisions.
| Process | Stream | Remote status | What the parent should say |
|---|---|---|---|
| Alive | Connected | Running | Work is active and being observed |
| Alive | Disconnected | Unknown | Worker health is possible, but progress is stale or unknown |
| Alive | Connected | Cancelled | The process may be cleaning up; the remote run is terminal |
| Exited | Connected briefly | Unknown | Preserve the exit or disconnect record; do not invent completion |
| Alive | Connected | Completed | Stop waiting and inspect the final result and artifacts |
The table is a policy model rather than a claim about a universal status API. It gives the product separate labels for “the process exists,” “events are arriving,” and “the service says the run ended.” Those labels lead to different actions.
Health checks should also be allowed to fail without killing the work. If a progress endpoint times out, the parent can keep the worker alive while marking progress unavailable. If the tool execution endpoint fails, that is a work failure and should be attached to the tool request. If the trace writer fails, the product may need to stop or quarantine the run because later review cannot trust the record.
The ownership rule is simple. Record each fact where it becomes knowable. Join the facts later by run and call identifiers. Do not use a convenient status field to stand in for evidence owned by another boundary.
Failure cases belong in the contract
Observability changes should include failure tests alongside a busy success path.
| Failure case | Record that remains honest |
|---|---|
| The stream disconnects after a tool request | Request is present; completion is unknown |
| The remote service cancels the run | Remote terminal status is recorded when refreshed |
| The bridge cannot answer local progress | Progress is unknown; the worker is not failed because telemetry failed |
| A tool call has malformed arguments | The request or decode error is recorded; no success is inferred |
| The provider omits usage or timing | Cost or duration stays incomplete and is excluded from complete aggregates |
| The worker finishes without a final message | The run is incomplete, not a successful empty answer |
The record should also preserve the difference between an absent event and an event with an empty value. An empty argument object can be a valid request. No tool event at all is a different observation.
The WHATWG Server-Sent Events specification defines the event transport used by the stream. It defines how events travel. It does not add a tool-completion event to a service that never sends one.
The shared route made deletion possible
The follow-up execution-path deletion made the coding-agent program that previously had a special route use the shared bridge. That cleanup removed the special executor and tool-connection path so the program uses the shared bridge like the other supported workers.
The deletion was safe only for the capabilities the bridge could expose. It did not turn request-only tool evidence into completion evidence. It did not add a per-worker environment channel. The accepted losses remain part of the route’s contract.
The current agent-runtime README describes the package as a TypeScript runtime that records runs and connects domain behavior to adapters such as model services and Sandbox. The runtime source is the right place to check the package surface that your application pins. The Tangle AI documentation describes the broader relationship between sandbox execution, inference, and traces.
Measure at the boundary that owns the fact
If a product needs tool success, measure it where the tool executes. If it needs model latency, measure the provider request and response. If it needs workspace state, capture file events or artifacts at the sandbox boundary. If it needs a reviewer decision, record that decision as a separate evaluation event.
Do not ask one bridge stream to prove facts that belong to four different systems. Join those records with a stable run and call identifier instead.
The practical flow looks like this:
model event
  -> bridge request span
  -> tool execution
       -> tool result span
       -> artifact or state change
  -> evaluation
       -> accepted, rejected, or needs review
Each arrow is a place where evidence can be lost. Each missing event should remain visible in the final trace.
What is AI agent observability?
AI agent observability is the set of run records and live signals that let a surrounding system see what an agent is doing and decide whether to wait, steer, stop, retry, or review it.
Does the bridge report successful tool execution?
No. It records the model’s tool request and arguments. When the bridge protocol does not report tool completion, status and duration remain unknown.
Why not mark every observed tool request as successful?
A request can fail, be cancelled, or never reach the tool. Marking it successful would turn missing evidence into a false result.
Can a progress read block the worker?
The local activity read is immediate. The remote status refresh is separate and limited to one request per second in the public implementation described here.
Does a trace prove that the agent completed the user’s task?
No. A trace proves what the runtime recorded. Task correctness still requires tests, policy checks, evaluation, and review appropriate to the action.
What should I do when a field is missing?
Keep it unknown, label the missing evidence, and measure the fact at the system boundary that owns it.
The next boundary is the workspace around the worker: AI Dev Containers for Production Agents covers files, processes, cleanup, and review when the client is no longer watching live.